Interactive Infographic – Switzerland's glaciers
See the infographic here: longread.epfl.ch
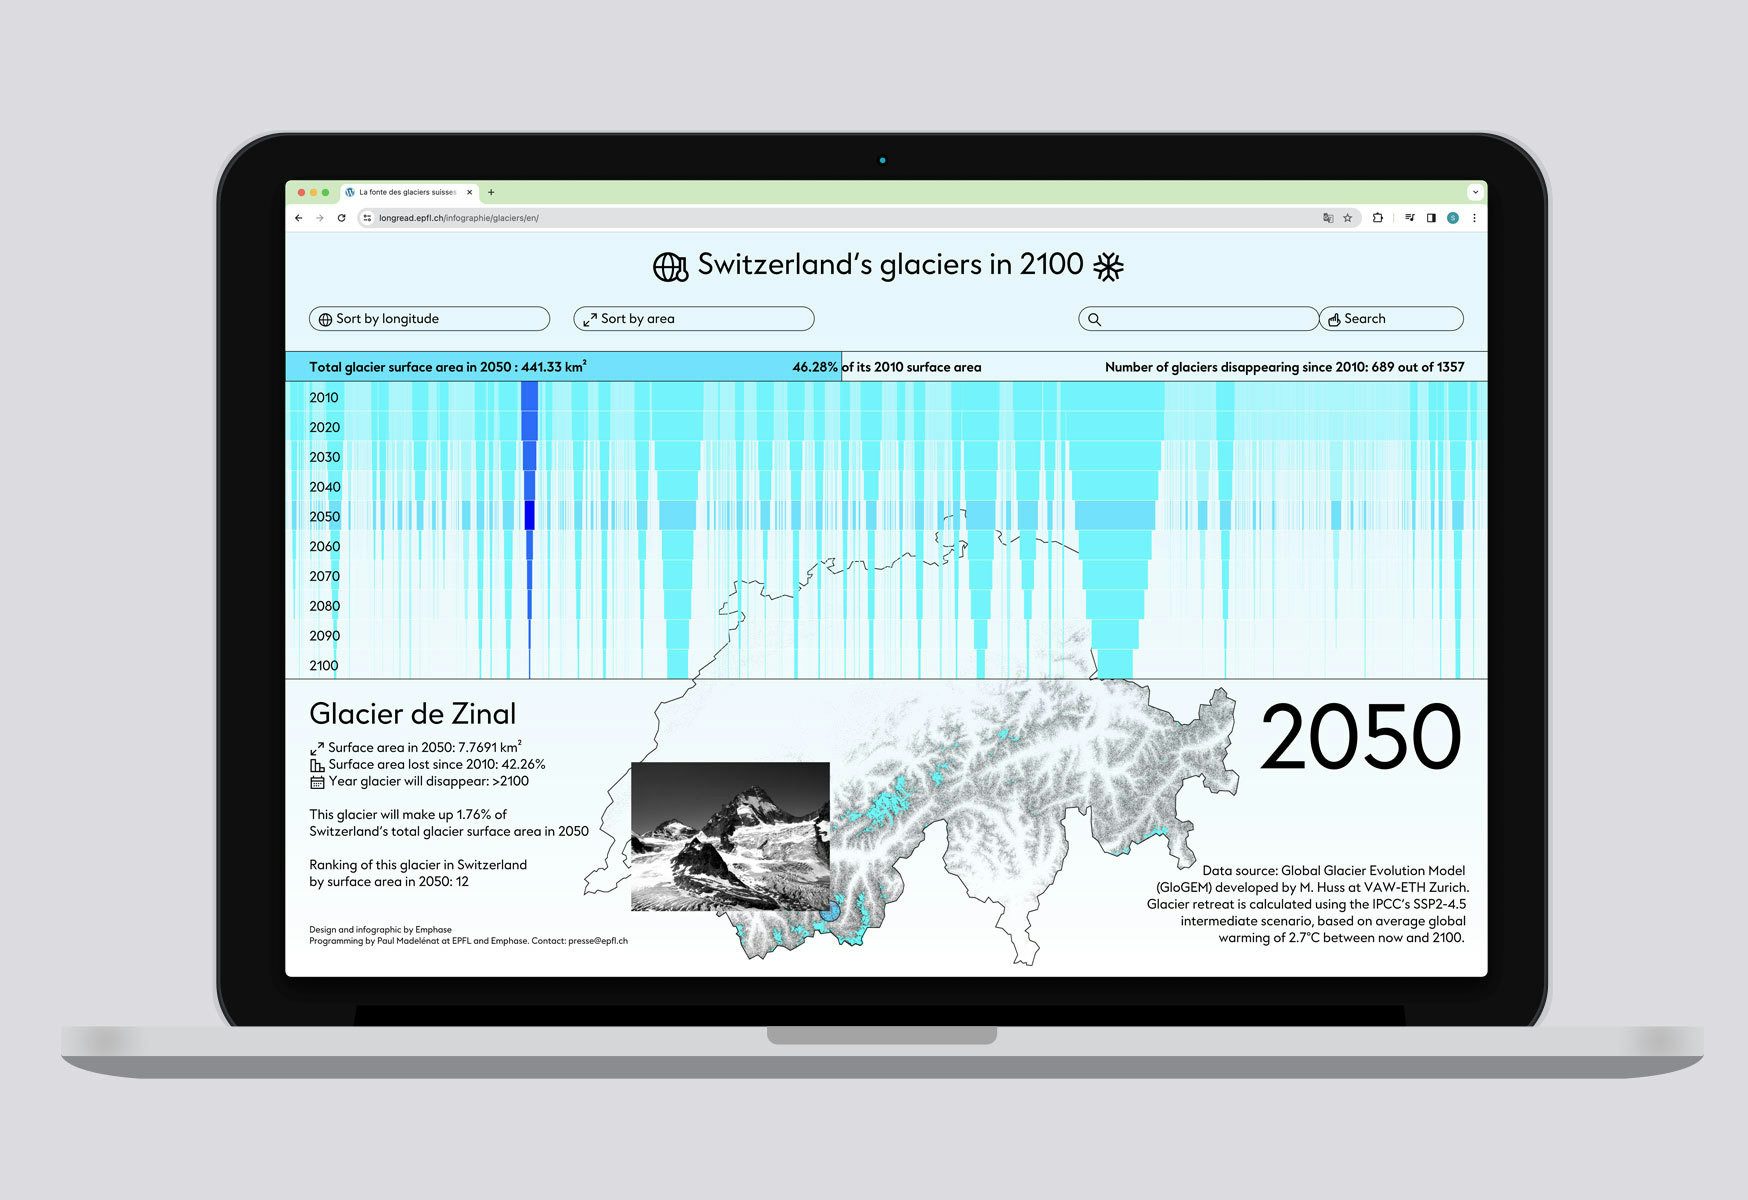
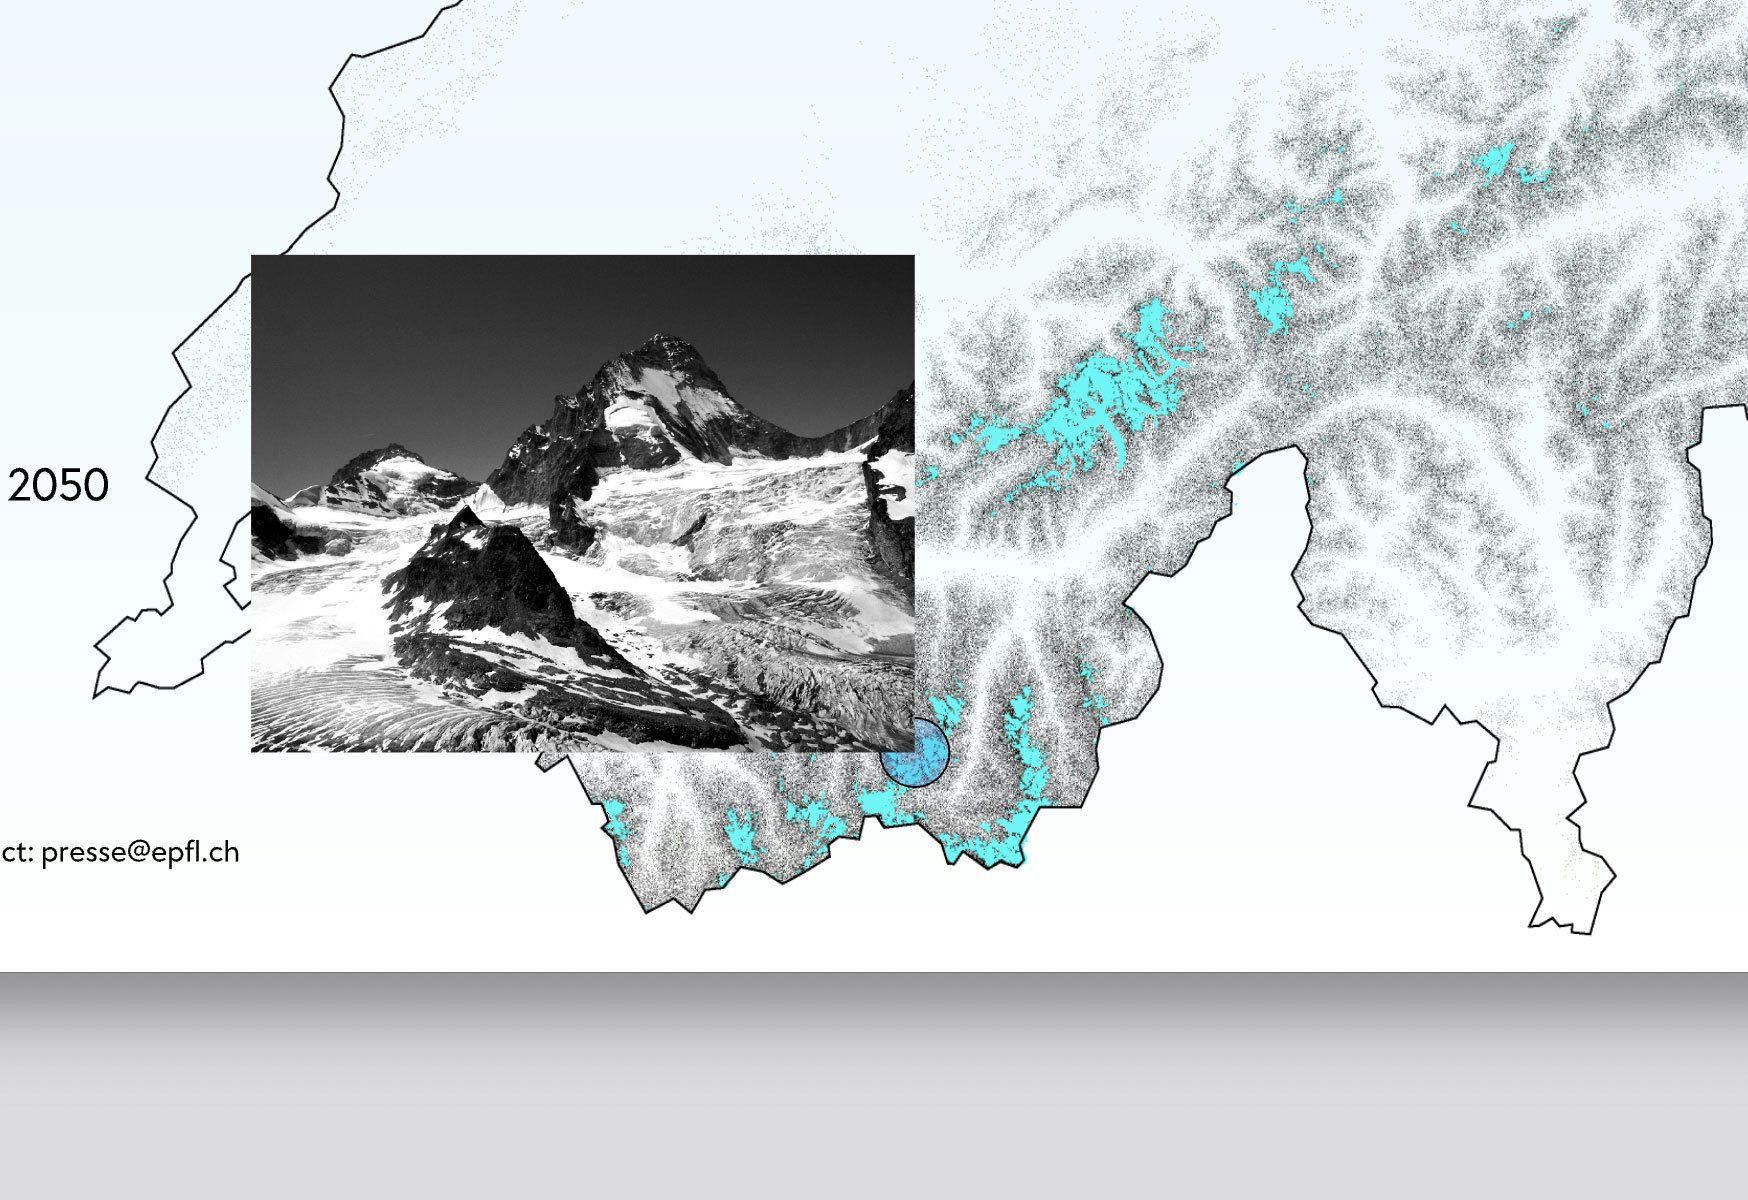
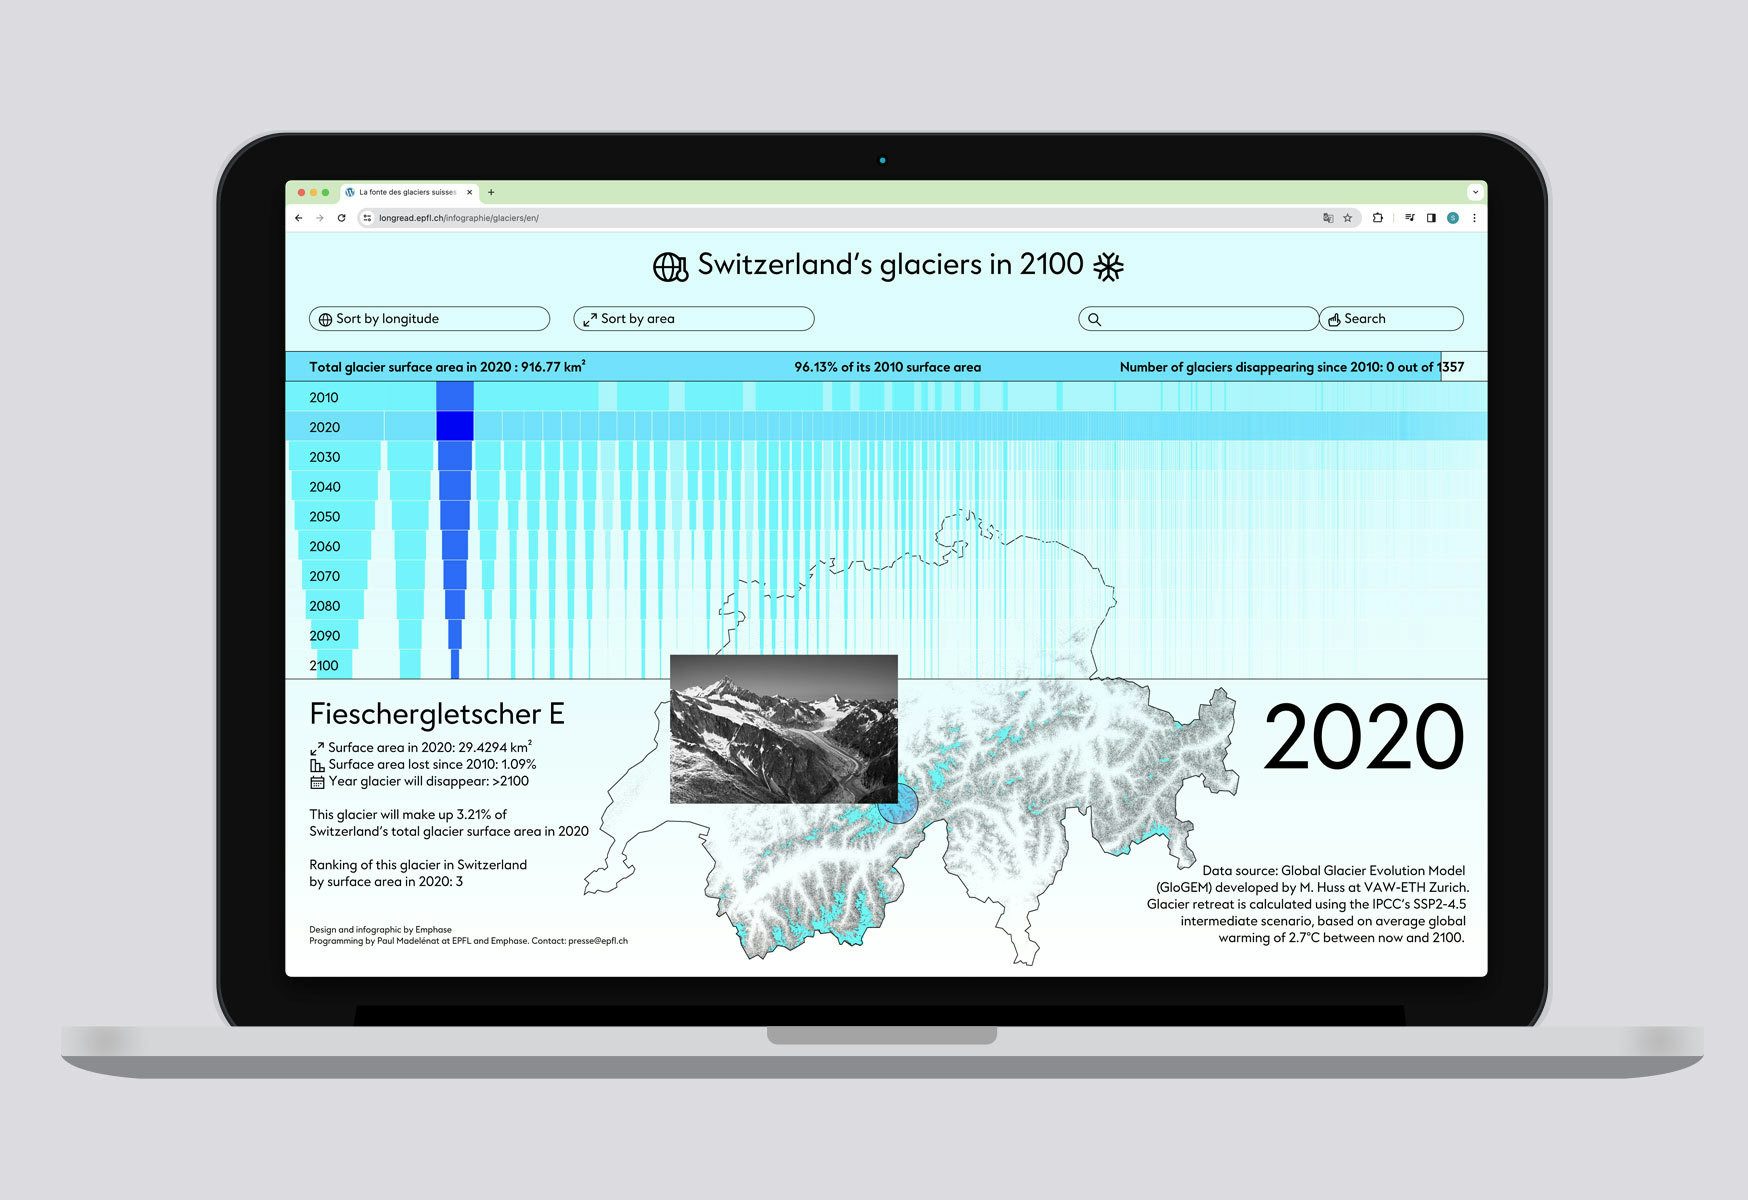
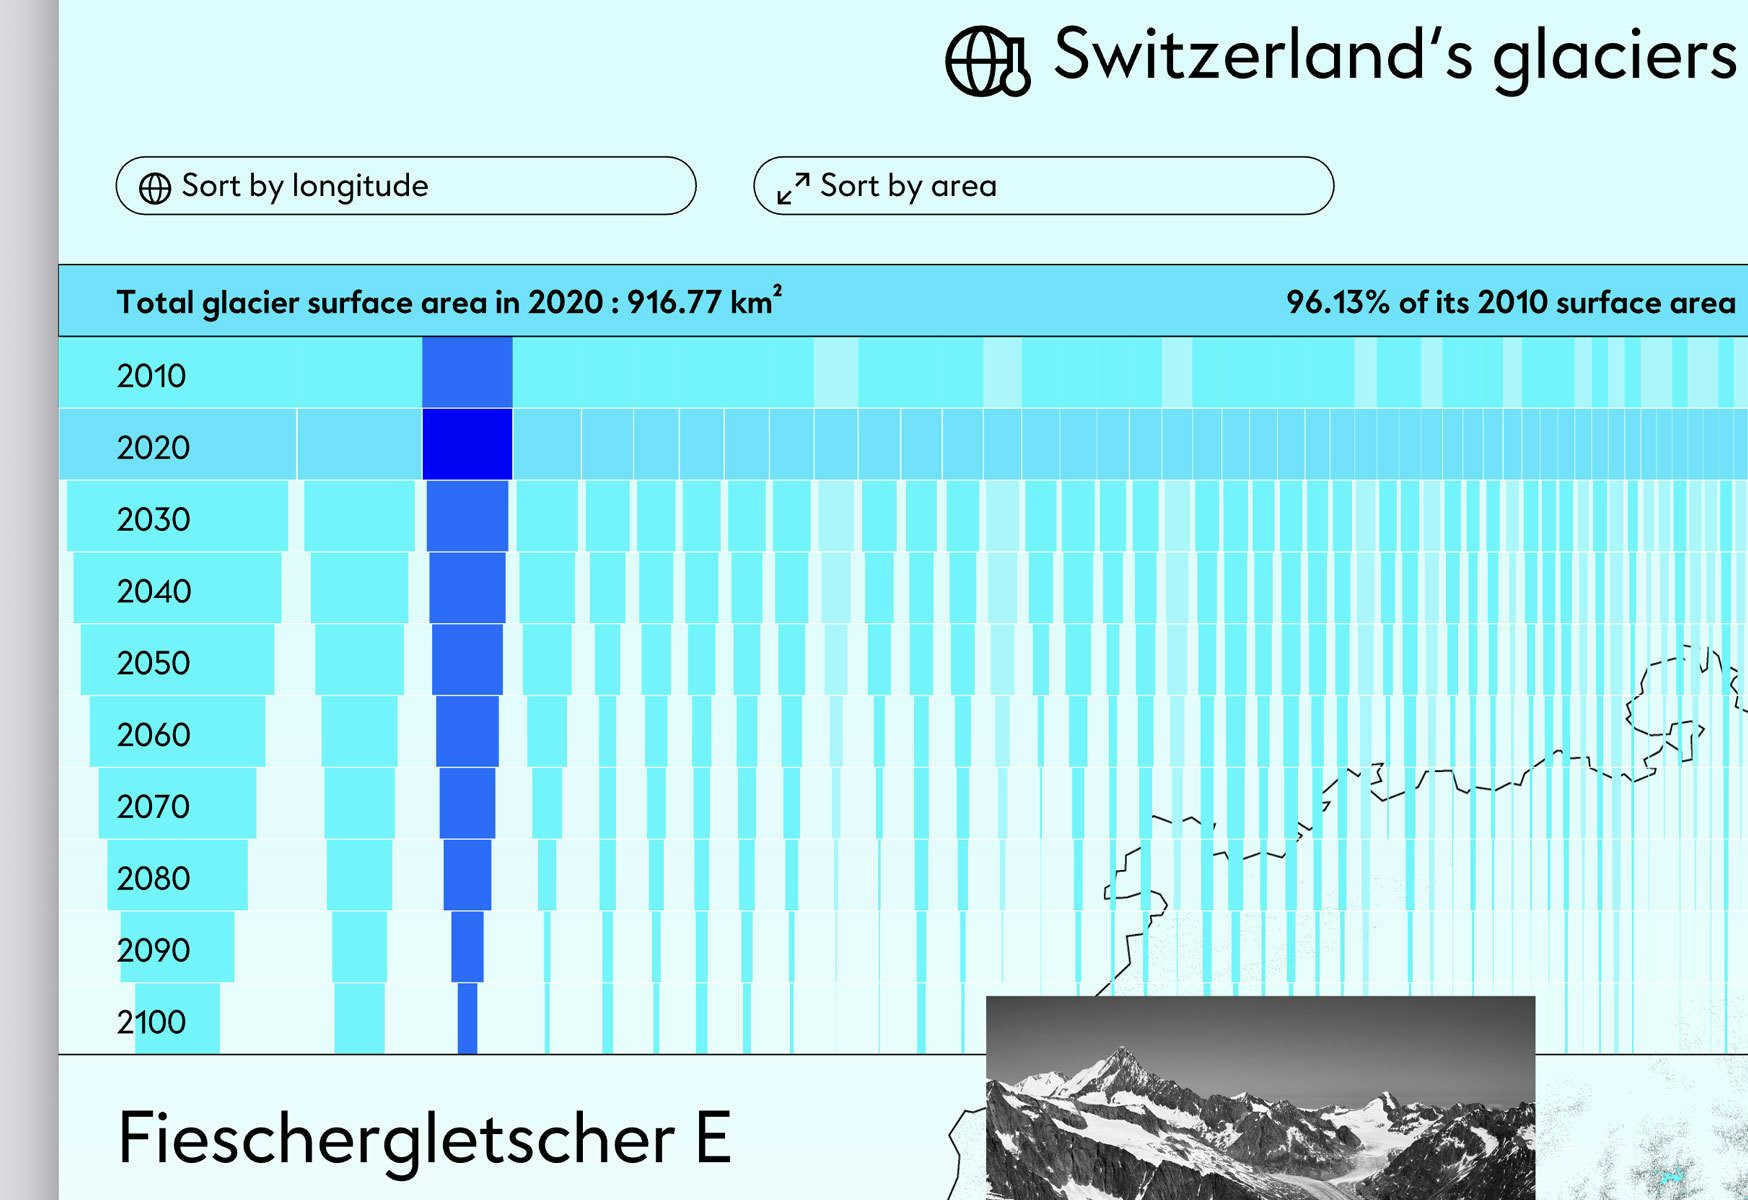
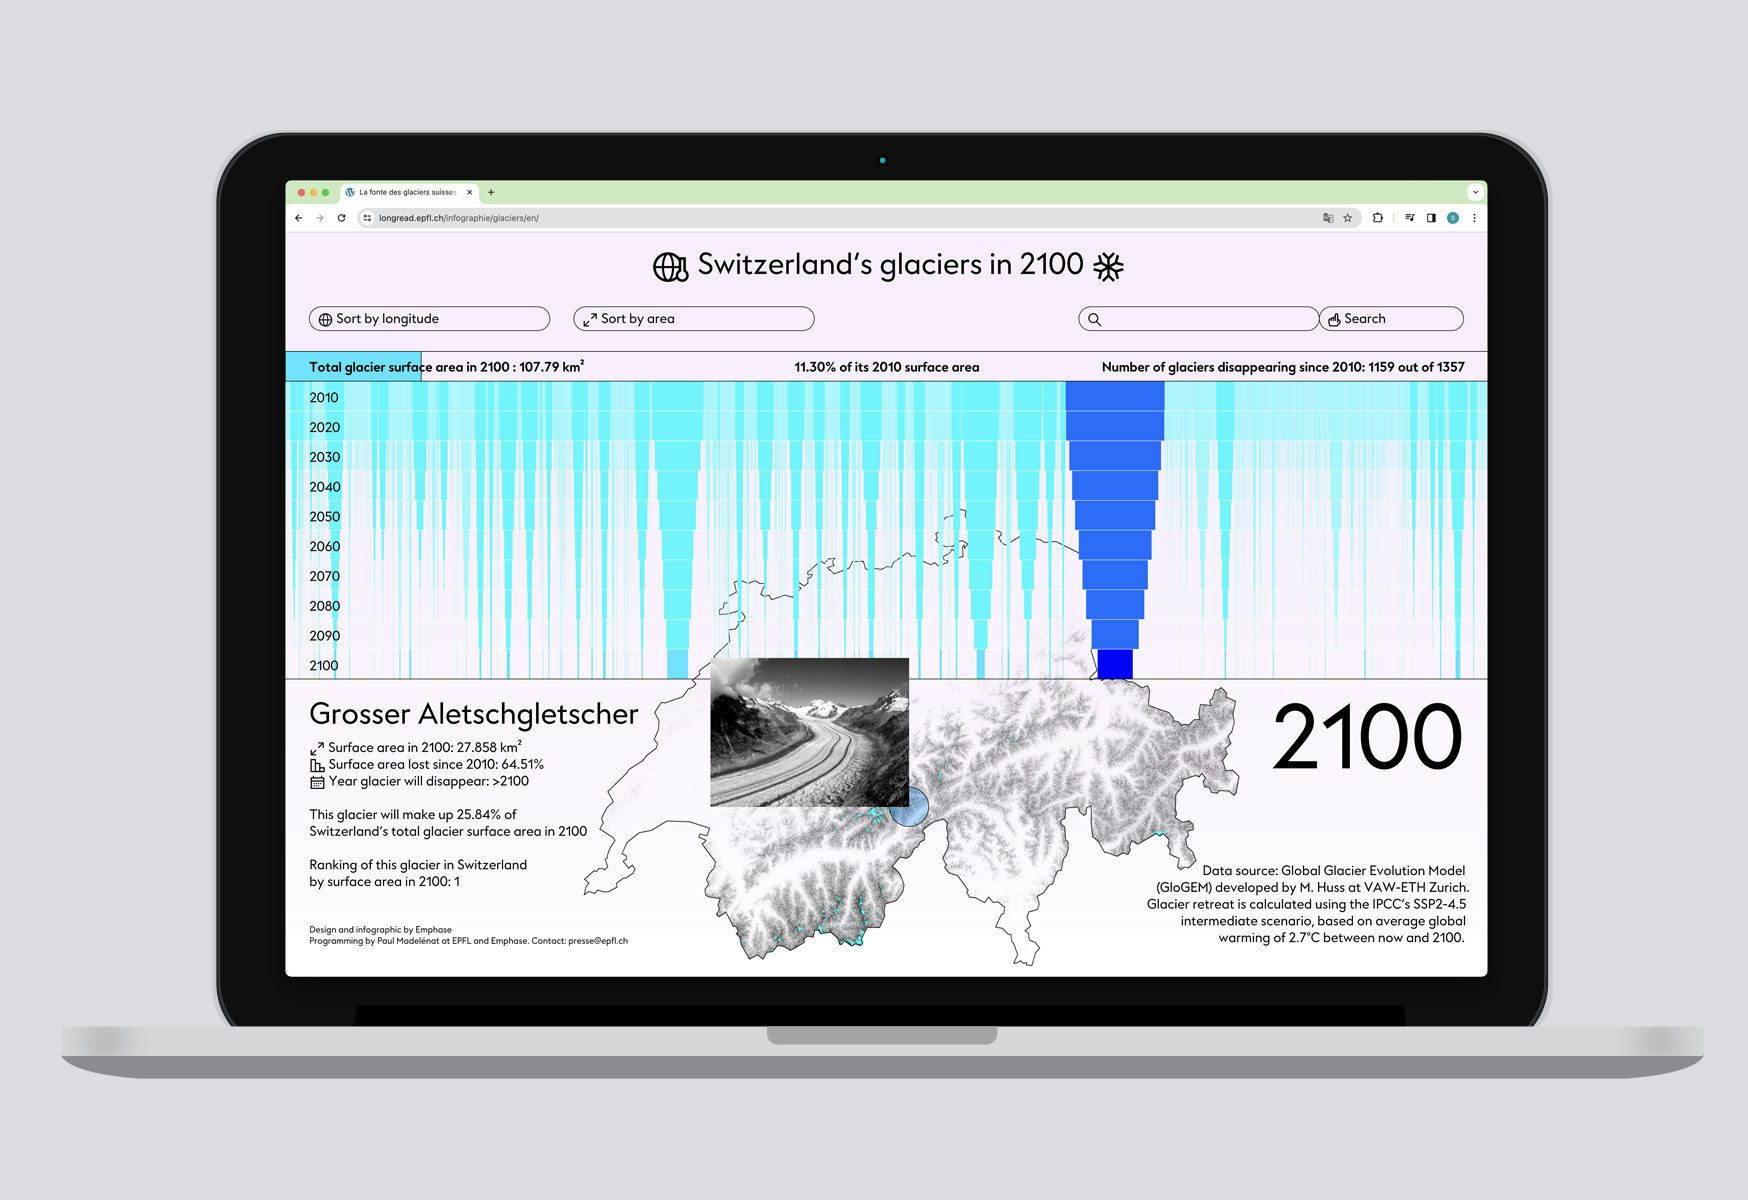
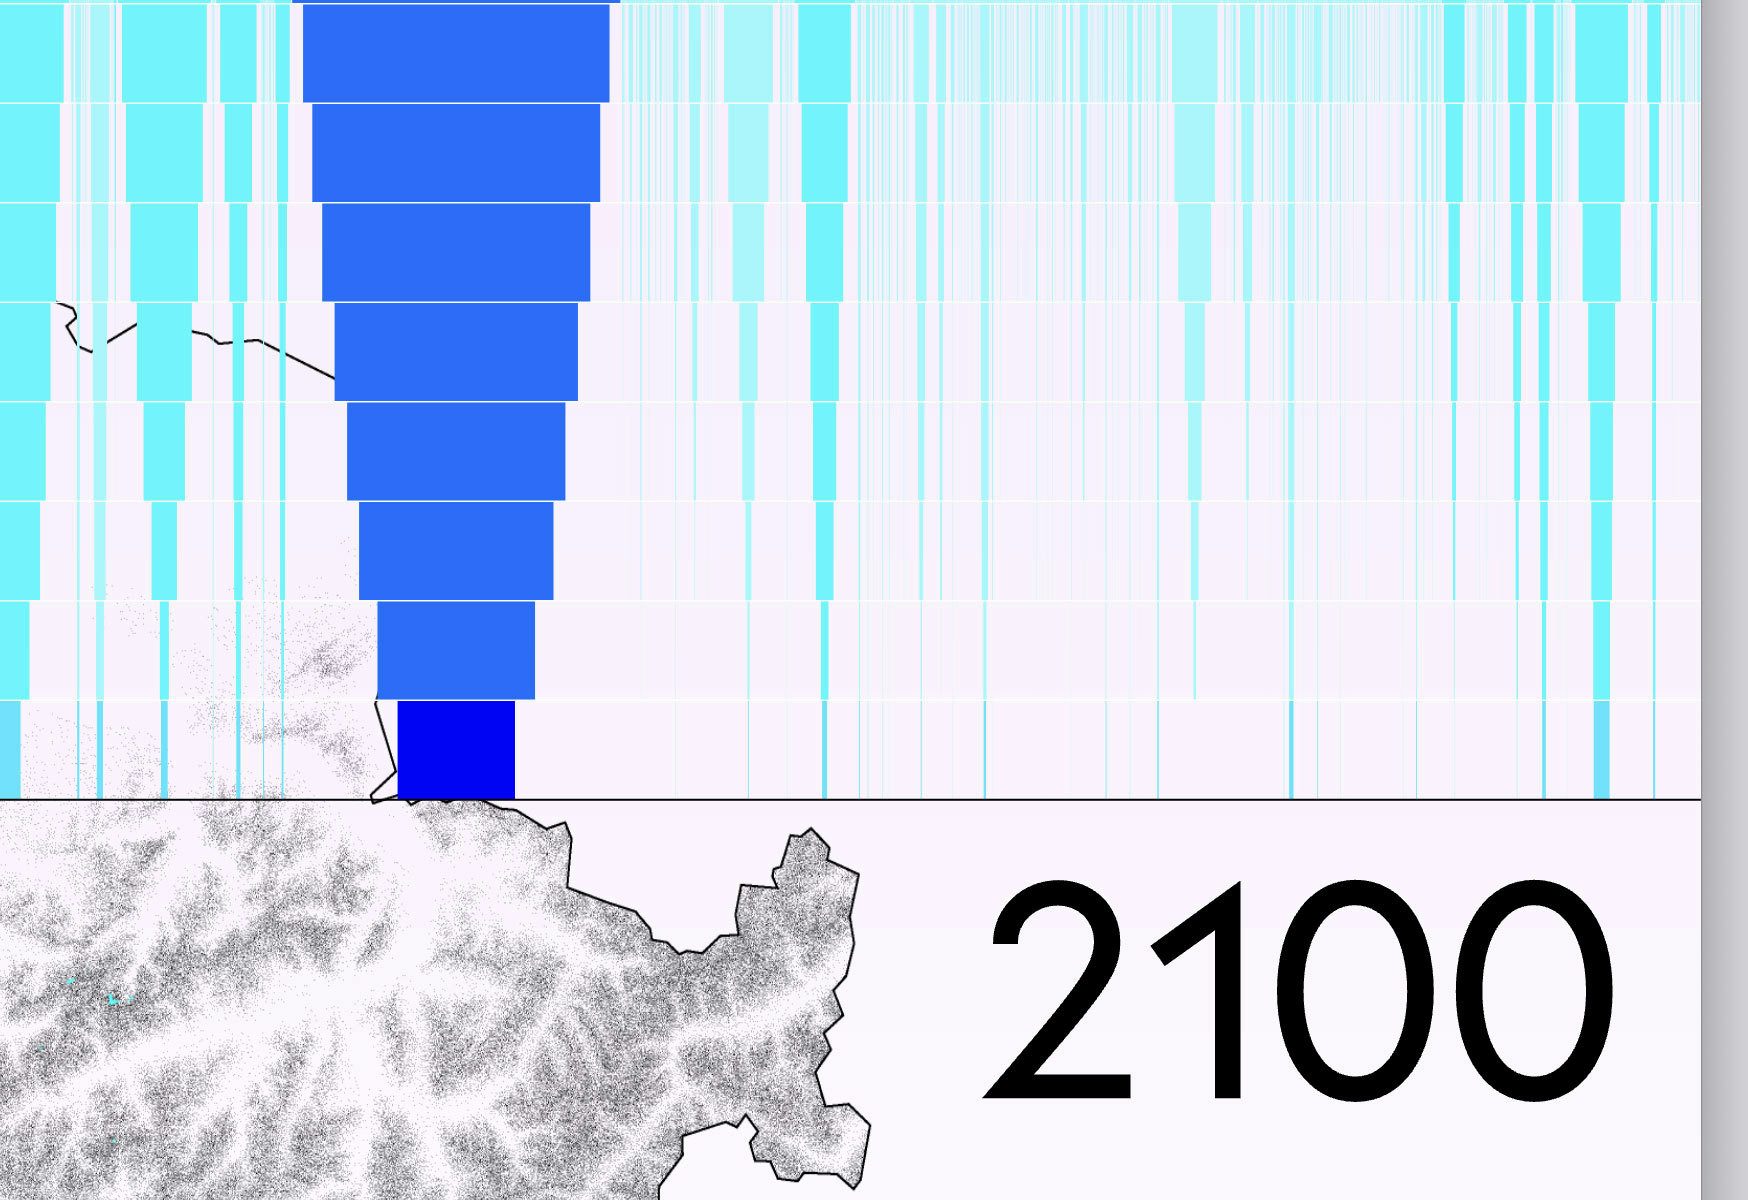
Interactive infographic for the "Dimensions" magazine of the Swiss Federal Institute of Technology in Lausanne. The infographic visualizes the melting of Swiss glaciers by 2100. Each glacier is represented in the form of stalactites. The stalactites consist of 10 rectangles, one rectangle per decade. These are proportional to their surface areas. In the lower part, one can also see the glaciers and their melting geographically. Above the stalactites, the total surface area of the Swiss glaciers is displayed by decade.
With a mouse rollover, one can explore the infographic and obtain details, photos, and the location of each glacier according to the decade. It is also possible to sort the data according to the glacier's surface area and search for specific glaciers using the search bar.
Data source: results from the Global Glacier Evolution Model (GloGem) developed at VAW-ETH Zurich (M.Huss). The retreat of the glaciers is calculated based on the IPCC's SSP2-4.5 scenario. This intermediate scenario predicts a global average warming of +2.7° by 2100.